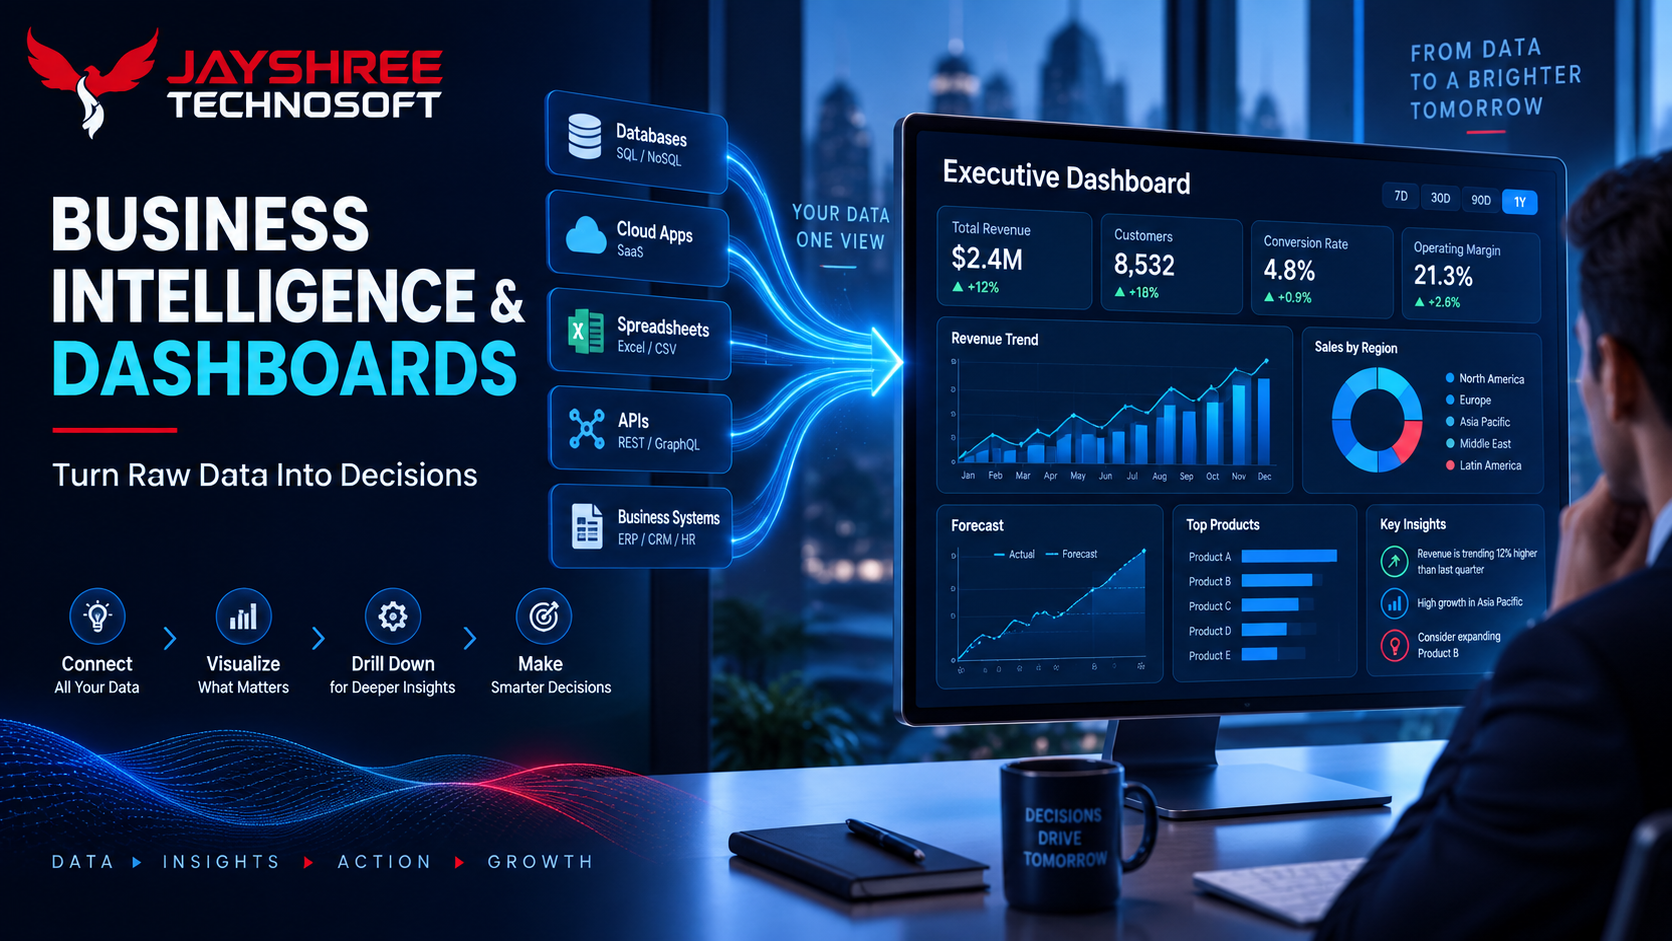
Most businesses generate far more data than anyone actually looks at. Sales figures, website analytics, inventory numbers, and support tickets often sit in separate systems, checked inconsistently, if at all. Business intelligence and custom dashboard development exists to pull this scattered data into a single, decision-ready view — but only when it's built around the questions a business actually needs answered, not a generic template of charts.
Why Off-the-Shelf Dashboards Often Get Ignored
A dashboard loaded with every metric a tool can technically display tends to get checked once during setup and then ignored — not because the data isn't valuable, but because nobody has time to interpret twenty charts to find the two or three numbers that actually matter for a decision that day.
What Makes a Dashboard Actually Get Used
Built Around Specific Decisions, Not Just Available Data
The right starting question isn't "what data do we have," but "what decision does someone need to make this week, and what number would help them make it faster." A dashboard designed around real decisions gets checked; one designed around available data tables often doesn't.
Role-Specific Views
A sales manager, a warehouse supervisor, and a business owner need different views of the same underlying data. Building one dashboard trying to serve everyone usually serves no one particularly well.
Real-Time or Near-Real-Time Where It Matters
For operational decisions — inventory levels, active support tickets, live sales — stale data undermines trust in the dashboard quickly. For strategic reviews, daily or weekly refreshes are often sufficient, and building for unnecessary real-time updates just adds cost.
Alerts, Not Just Passive Charts
The most useful BI systems don't just wait to be checked — they proactively flag when a number crosses a threshold that needs attention, turning a passive dashboard into an active early-warning system.
Connecting Data From Multiple Sources
The real engineering challenge in most BI projects isn't the visualization layer — it's reliably pulling and reconciling data from multiple systems (a CRM, an accounting tool, a website analytics platform, an inventory system) that were never designed to talk to each other, and keeping that pipeline running as each underlying system changes over time.
Avoiding the "Beautiful But Useless" Trap
It's easy to build a visually impressive dashboard that photographs well for a pitch deck but doesn't actually change anyone's daily decisions. The measure of a good BI system isn't how it looks in a demo — it's whether the people who need it are still checking it, unprompted, three months after launch.
How Jayshree Technosoft Builds BI Systems
Jayshree Technosoft LLP's approach to business intelligence and dashboard development starts with identifying the specific operational or strategic decisions a client's team makes regularly, then builds the data pipeline and dashboard views around those decisions — rather than defaulting to a generic analytics template.
Drowning in data but short on clear answers? Talk to the team about what a decision-focused dashboard could look like for your business.
Recent Articles
Custom CRM & Software Solutions for Mobile & Accessories Stores: How Jayshree Technosoft Can Help
Custom CRM & Software Solutions for Property Valuation & Survey Companies: How Jayshree Technosoft Can Help
Custom CRM & Software Solutions for Accounting Firms: How Jayshree Technosoft Can Help